Jez Humble, Joanne Moleksy & Barry O’Reilly have teamed up to deliver an excellent book on applying lean and agile practices to enterprise business. The book focus on how to maximise product discovery, product development, validated learning through experimentation, prioritisation through cost of delay, lean governance principles and modern funding practices to maximise value delivered in the shortest time. The book provides case studies on how traditional enterprise practices such as architecture, project management office (PMO), change management, security and operations can apply similar lean product development methods to maximise value creation. It provides and overview on modern software practices such as continuous delivery, test automation, experimentation and flow based value creation.
Please see below book notes / snippets (copied from my Kindle highlights with some minor edits, without permission). I highly recommend buying the book & keeping as your lean, agile bible on how to continuously learn and get things done.

On Running a Lean Business
Part I. Orient
The business world is moving from treating IT as a utility that improves internal operations to using rapid software- and technology-powered innovation cycles as a competitive advantage. Shareholder value is the dumbest idea in the world…[it is] a result, not a strategy…Your main constituencies are your employees, your customers, and your products. Research has shown that focusing only on maximising profits has the paradoxical effect of reducing the rate of return on investment. Rather, organisations succeed in the long term through developing their capacity to innovate and adopting the strategy articulated by Jack Welch in the above epigraph: focusing on employees, customers, and products.
The Toyota Production System (TPS) makes building quality into products the highest priority, so a problem must be fixed as soon as possible after it’s discovered, and the system must then be improved to try and prevent that from happening again. TPS introduced the famous andon cord process. In contrast, the heart of the TPS is creating a high-trust culture in which everybody is aligned in their goal of building a high-quality product on demand and where workers and managers collaborate across functions to constantly improve — and sometimes radically redesign — the system. These ideas from the TPS — a high-trust culture focused on continuous improvement (kaizen), powered by alignment and autonomy at all levels — are essential to building a large organisation that can adapt rapidly to changing conditions. The TPS, instead, requires workers to pursue mastery through continuous improvement, imbues them with a higher purpose — the pursuit of ever-higher levels of quality, value, and customer service — and provides a level of autonomy by empowering them to experiment with improvement ideas and to implement those that are successful.
Giving people pride in their work rather than trying to motivate them with carrots and sticks is an essential element of a high-performance culture.
The TPS does away with the concept of seniority in which union workers are assigned jobs based on how many years of service they have, with the best jobs going to the most senior. Under the TPS, everybody has to learn all the jobs required of their team and rotate through them. Toyota has always been very open about what it is doing, giving public tours of its plants, even to competitors — partly because it knows that what makes the TPS work is not so much any particular practices but the culture. Many people focus on the practices and tools popularised by the TPS, such as the andon cords. One GM vice president even ordered one of his managers to take pictures of every inch of the NUMMI plant so they could copy it precisely. The result was a factory with andon cords but with nobody pulling them because managers (following the principle of extrinsic motivation) were incentivised by the rate at which automobiles — of any quality — came off the line.
The key to understanding a lean enterprise is that it is primarily a human system.
- Pathological organisations are characterised by large amounts of fear and threat. People often hoard information or withhold it for political reasons, or distort it to make themselves look better.
- Bureaucratic organisations protect departments. Those in the department want to maintain their “turf,” insist on their own rules, and generally do things by the book — their book.
- Generative organisations focus on the mission. How do we accomplish our goal? Everything is subordinated to good performance, to doing what we are supposed to do.

Figure 1. How organisations process information
Analysis showed that firms with high-performing IT organisations were twice as likely to exceed their profitability, market share, and productivity goals.
The survey also set out to examine the cultural factors that influenced organisational performance. The most important of these turned out to be whether people were satisfied with their jobs, based on the extent to which they agreed with the following statements (which are strongly reminiscent of the reaction of the NUMMI workers who were introduced to the Toyota Production System):
- I would recommend this organisation as a good place to work.
- I have the tools and resources to do my job well.
- I am satisfied with my job.
- My job makes good use of my skills and abilities.
Statistical analysis of the results showed that team culture was not only strongly correlated with organisational performance, it was also a strong predictor of job satisfaction. The results are clear: a high-trust, generative culture is not only important for creating a safe working environment — it is the foundation of creating a high-performance organisation.
Mission Command as an alternative to Command & Control
Command and control: the idea from scientific management that people in charge make the plans and the people on the group execute them is an outdated model, highlighted in the defeat of the Prussian Army in 1806 my Napoleon. Scharnhorst noted that Napoleon’s officers had the authority to make decisions as the situation on the ground changed, without waiting for approval through the chain of command. This allowed them to adapt rapidly to changing circumstances. “No plan survives contact with the enemy”, instead, he has this advice: “The higher the level of command, the shorter and more general the orders should be”. Crucially, orders always include a passage which describes their intent, communicating the purpose of the orders. This allows subordinates to make good decisions in the face of emerging opportunities or obstacles which prevent them from following the original orders exactly (called Auftragstaktik or Mission Command).
Friction and Complex Adaptive Systems Clausewitz’ concept of friction is an excellent metaphor to understand the behaviour of complex adaptive systems such as an enterprise (or indeed any human organisation). Bungay argues that friction creates three gaps:
-
- First, a knowledge gap arises when we engage in planning or acting due to the necessarily imperfect state of the information we have to hand, and our need to making assumptions and interpret that information.
- Second, an alignment gap is the result of people failing to do things as planned, perhaps due to conflicting priorities, misunderstandings, or simply someone forgetting or ignoring some element of the plan.
- Finally, there is an effects gap due to unpredictable changes in the environment, perhaps caused by other actors, or unexpected side effects producing outcomes that differ from those we anticipated.

Figure 2. Friction create three gaps, and how to manage them
This principle is applied in multiple contexts:
Budgeting and financial management
- Instead of a traditional budgeting process which requires all spending for the next year to be planned and locked down based on detailed projections and business plans, we set out high-level objectives across multiple perspectives such as people, organisation, operations, market, and finance that are reviewed regularly. This kind of exercise can be used at multiple levels, with resources allocated dynamically when needed and the indicators reviewed on a regular basis.
Program management
- Instead of creating detailed, upfront plans on the work to be done and then breaking that work down into tiny little bits distributed to individual teams, we specify at the program level only the measurable objectives for each iteration. The teams then work out how to achieve those objectives, including collaborating with other teams and continuously integrating and testing their work to ensure they will meet the program-level objectives.
Process improvement
- Working to continuously improve processes is a key element of the TPS and a powerful tool to transform organisations. We present the Improvement Kata in which we work in iterations, specifying target objectives for processes and providing the people who operate the processes the time and resources to run experiments they need to meet the target objectives for the next iteration.
Crucially, these mission-based processes must replace the command and control processes, not run alongside them.
The long-term value of an enterprise is not captured by the value of its products and intellectual property but rather by its ability to continuously increase the value it provides to customers — and to create new customers — through innovation.

Figure 3. Technology adoption lifecycle, from Dealing with Darwin by Geoffrey A. Moore, 2006
For this vision to become reality, there are two key assumptions that must be tested: the value hypothesis and the growth hypothesis.
We then design an experiment, called the minimum viable product, which we build in order to gather the necessary data from real customers to determine if we have a product/market fit. If our hypothesis is incorrect, we pivot, coming up with a new value hypothesis based on what we learned, following the steps above, every iteration will result in validated learning.
What is an Option?
Purchasing an option gives us the right, but not the obligation, to do something in the future (typically to buy or sell an asset at a fixed price). Options have a price and an expiry date. Investing a fixed amount of time and money to investigate the economic parameters of an idea — be it a business model, product, or an innovation such as a process change — is an example of using optionality to manage the uncertainties of the decision to invest further.
Optionality is a powerful concept that lets you defer decisions on how to achieve a desired outcome by exploring multiple possible approaches simultaneously.
“When we decided to do a microprocessor, in hindsight, I think I made two great decisions. I trusted the team, and gave them two things that Intel and Motorola had never given their people: the first was no money and the second was no people. They had to keep it simple.”
Whenever you hear of a new IT project starting up with a large budget, teams of tens or hundreds of people, and a timeline of many months before something actually gets shipped, you can expect the project will go over time and budget and not deliver the expected value.
Sadly, however, whether the project “succeeds” according to these criteria is irrelevant and insignificant when compared to whether we actually created value for customers and for our organisation. Data gathered from evolving web-based systems reveals that the plan-based approach to feature development is very poor at creating value for customers and the organisation. Amazon & Microsofts research reveals the “humbling statistics”: 60%–90% of ideas do not improve the metrics they were intended to improve. Based on experiments at Microsoft:
- 1/3 of ideas created a statistically significant positive change,
- 1/3 produced no statistically significant difference, and
- 1/3 created a statistically significant negative change.
Due to a cognitive bias known as the planning fallacy, executives tend to “make decisions based on delusional optimism rather than on a rational weighing of gains, losses, and probabilities. They overestimate benefits and underestimate costs. They spin scenarios of success while overlooking the potential for mistakes and miscalculations. As a result, they pursue initiatives that are unlikely to come in on budget or on time or to deliver the expected returns — or even to be completed.”
Finally, because the project approach judges people according to whether work is completed on time and on budget, not based on the value delivered to customers, productivity gets measured based on output rather than outcomes.
We create an unsustainable “hero culture” that rewards overwork and high utilisation (making sure everybody is busy) rather than doing the least possible work to achieve the desired outcomes.
We describe how to run large-scale programs of work using the following principles:
- Define, measure, and manage outcomes rather than output. Applying the Principle of Mission, we specify “true north” for our program of work — our ideal stakeholder outcomes. Then, at the program level, we work iteratively, specifying for each iteration the measurable program-level outcomes we want to achieve. How to achieve these outcomes is delegated to teams working within the program. Based on the feedback from real customers after each iteration, we work to improve quality of demand, improve speed, and improve quality of outcomes.
- Manage for throughput rather than capacity or utilisation. We implement Kanban principles by making all work visible and limiting work in process. We then aim to stop starting work and start finishing it as soon as possible. We continuously undertake process improvement work to reduce lead time — the time it takes to deliver work — throughout the system. We use continuous delivery and work in small increments to make it cheap and low risk to deliver work in small batches with easier feedback loops.
- Ensure people are rewarded for favouring a long-view system-level perspective over pursuing short-term functional goals. People should be rewarded for continuous and effective (win-win) collaboration, for minimising the amount of work required to achieve the desired outcomes, and for reducing the complexity of the systems we create to enable these outcomes. People should not be punished when failures occur; rather, we must build a culture of experimentation and collaboration, design systems which make it safe to fail, and put in place processes so we can learn from our mistakes and use this information to make our systems more resilient.
Balancing the Enterprise Portfolio

Figure 4. The 3 product or business horizons
The problems occur when the acquired company — working on a horizon 3 or 2 product — is subjected to the horizon 1 governance, financial targets, and management structures of the acquiring enterprise, completely destroying its ability to innovate.
Our hypothesis is that organisations survive and grow in the medium and long term by balancing the ability to continuously explore potential new business models with effective exploitation of existing ones.
Intuit uses a simple model to balance horizons 1, 2, and 3, Google follows a similar model, but with different allocations:
- 70% to Horizon 1
- 20% to Horizon 2
- 10% to Horizon 3
Part II. Explore
When faced with a new opportunity or a problem to be solved, our human instinct is to jump straight to a solution without adequately exploring the problem space, testing the assumptions inherent in the proposed solution, or challenging ourselves to validate the solution with real users.
Our mission would be to prevent anybody from commencing a major program to solve the problem or pursue the opportunity until they do the following:
- Define the measurable business outcome to be achieved
- Build the smallest possible prototype capable of demonstrating measurable progress towards that outcome
- Demonstrate that the proposed solution actually provides value to the audience it is designed for
“Even in projects with very uncertain development costs, we haven’t found that those costs have a significant information value for the investment decision. The single most important unknown is whether the project will be canceled…The next most important variable is utilisation of the system, including how quickly the system rolls out and whether some people will use it at all.” Thus the business case essentially becomes a science fiction novel based in an universe that is poorly understood — or which may not even exist! Meanwhile significant time is wasted on detailed planning, analysis, and estimation, which provides large amounts of information with extremely limited value.
There are two factors we care about in a business plan. The first is the sensitivity of the key metric to the various variables in the business case. The second is the level of uncertainty in the variables to which the key metric is sensitive. Given distributions and ranges for the key variables, a simple but powerful approach is to perform a Monte Carlo simulation to work out the possible outcomes.
We should stop using the word “requirements” in product development, at least in the context of nontrivial features. What we have, rather, are hypotheses. We believe that a particular business model, or product, or feature, will prove valuable to customers. But we must test our assumptions. We can take a scientific approach to testing these assumptions by running experiments.
In Running Lean (O’Reilly), Ash Maurya explains how to execute a Lean Startup model:
- Do not spend a lot of time creating a sophisticated business model. Instead, design a simplified business model canvas which captures and communicates the key operating assumptions of your proposed business model.
- Gather information to determine if you have a problem worth solving — meaning that it is both solvable and people will pay for it to be solved. If both of these conditions obtain, we have achieved a problem/solution fit.
- Then, design a minimum viable product (MVP) — an experiment designed to maximize learning from potential early adopters with minimum effort. In the likely case that the results of the MVP invalidate your product hypothesis, pivot and start again. Continue this process until you decide to abandon the initial problem, run out of resources, or discover a product/market fit. In the latter case, exit the explore phase and proceed to exploit the validated model.
- Throughout this process, update the business model canvas based on what you learn from talking to customers and testing MVPs.
The purpose of measurement is not to gain certainty but to reduce uncertainty. The job of an experiment is to gather observations that quantitatively reduce uncertainty. The key principle to bear in mind is this: when the level of uncertainty of some variable is high, we need very little information to significantly reduce that uncertainty.
Definition of Measurement
Measurement: A quantitively expressed reduction of uncertainty based on one or more observations.
This definition may seem counterintuitive unless you have experience running experiments in a scientific context. In experimental science, the result of a measurement is never simply a single value. It is, rather, a probability distribution which represents the range of possible values. Any measurement that doesn’t indicate the precision of the result is considered practically meaningless. For example, a measurement of my position with a precision of 1 meter is far more valuable than that same position with a precision of 500 miles. The point of investing in measurement in a scientific context is to reduce our uncertainty about the actual value of some quantity. Thus, in particular, if we express our estimates as precise numbers (as opposed to ranges), we are setting ourselves up for failure: the chance of us meeting a date 6 months in the future precisely to the day is practically zero.
Game theory actually provides a formula for the expected value of information (EVI). Hubbard defines the value of information as follows: “Roughly put, the value of information equals the chance of being wrong times the cost of being wrong.
The cost of being wrong — that is, what is lost if your decision doesn’t work out — is called an opportunity loss. When we multiply the opportunity loss by the chance of a loss, we get the expected opportunity loss (EOL). Calculating the value of information boils down to determining how much it will reduce EOL.

Figure 4. The OODA loop
Boyd’s theory of maneuver warfare. OODA stands for observe, orient, decide, act, the four activities that comprise the loop.

Figure 5. Deming’s Plan Do Check Act cycle
Deming cycle
When everybody in the organisation has been trained to employ the scientific approach to innovation as part of their daily work, we will have created a generative culture.

Figure 6. Traditional project planning versus Lean Startup Skill or behaviour
Discovery is a rapid, time-boxed, interactive set of activities that integrates the practices and principles of design thinking and Lean Startup. “Design thinking takes a solution-focused approach to problem solving, working collaboratively to iterate an endless, shifting path towards perfection. It works towards product goals via specific ideation, prototyping, implementation, and learning steps to bring the appropriate solution to light.”
As Dan Pink argues in Drive, there are three key elements to consider when building an engaged and highly motivated team. First, success requires a shared sense of purpose in the entire team. The vision needs to be challenging enough for the group to have something to aspire to, but clear enough so that everyone can understand what they need to do. Second, people must be empowered by their leaders to work autonomously to achieve the team objectives. Finally, people need the space and opportunity to master their discipline, not just to learn how to achieve “good enough.”
Go Gamestorming
Gamestorming by David Gray et al. and the supporting Go Gamestorming Wiki, contain numerous games that encourage engagement and creativity while bringing structure and clarity to collaborative ideation, innovation, and improvement workshops.

Figure 7. Divergent Thinking
Divergent thinking is the ability to offer different, unique, or variant ideas adherent to one theme; convergent thinking is the ability to identify a potential solution for a given problem. We start exploration with divergent thinking exercises designed to generate multiple ideas for discussion and debate. We then use convergent thinking to identify a possible solution to the problem. From here, we are ready to formulate an experiment to test it.

Figure 8. Business Model Canvas
The Business Model Canvas, shown in Figure 8, was created by Alex Osterwalder and Yves Pigneur along with 470 co-creators as a simple, visual business model design generator. It is a strategic management and entrepreneurial tool that enables teams to describe, design, challenge, invent, and pivot business models.The Business Model Canvas, freely available at http://www.businessmodelgeneration.com/canvas
Beyond the template itself, Osterwalder also came up with four levels of strategic mastery of competing on business models to reflect the strategic intent of an organization:
- Level 0 Strategy The Oblivious focus on product/value propositions alone rather than the value proposition and the business model.
- Level 1 Strategy The Beginners use the Business Model Canvas as a checklist.
- Level 2 Strategy The Masters outcompete others with a superior business model where all building blocks reinforce each other (e.g., Toyota, Walmart, Dell).
- Level 3 Strategy The Invincible continuously self-disrupt while their business models are still successful (e.g., Apple, Amazon).
There are a number of canvas created by others that focus on product development:
- The Lean Canvas: Makes the assumption that product/market fit is the riskiest hypothesis that must be tested.
- The Opportunity Canvas: Focuses discussions about what we’re building and why, then helps you understand how satisfying those specific customers and users furthers the organisation’s overall strategy.
- Value Proposition Canvas: Describes how our products and services create customer gains and how they create benefits our customers expect, desire, or would be interesting in using.
Minimal Viable Product Definition
Confusingly, people often refer to any validation activity anywhere along on this spectrum as an MVP, overloading the term and understanding of it in the organisation or wider industry. Marty Cagan, author of Inspired: How to Create Products Customers Love and ex-SVP for eBay, notably uses the term “MVP test” to refer to what Eric Ries calls an MVP. Cagan defines an MVP as “the smallest possible product that has three critical characteristics: people choose to use it or buy it; people can figure out how to use it; and we can deliver it when we need it with the resources available — also known as valuable, usable, and feasible,” to which we add “delightful,” since design and aesthetics are also as essential for an MVP as for a finished product.

Figure 9. Minimal Viable Product – Usable, Valuable, Feasible & Delightful
MVPs, as shown in figure 10. do not guarantee success; they are designed to test the assumptions of a problem we wish to solve without over-investing. By far the most likely outcome is that we learn our assumptions were invalid and we need to pivot or stop our approach. Our ultimate goal is to minimize investment when exploring solutions until we are confident we have discovered the right product — then, exploit the opportunity by adding further complexity and value to build the product right.

Figure 10. An example set of types of lean MVPs
Paul Graham, http://paulgraham.com/ds.html
Cagan defines vision as the shared understanding that “describes the types of services you intend to provide, and the types of customers you intend to serve, typically over a 2-5 year timeframe”
One Metric That Matters
One Metric That Matters (OMTM) is a single metric that we prioritize as the most important to drive decisions depending on the stage of our product lifecycle and our business model. It is not a single measure that we will use throughout our product lifetime: it will change over time depending on the problem area we wish to address. We focus on One Metric That Matters to:
- Answer the most pressing question we have by linking it to the assumptions in the hypothesis we want to test
- Create focus, conversation, and thought to identify problems and stimulate improvement
- Provide transparency and a shared understanding across the team and wider organization
- Support a culture of experimentation by basing it on rates or ratios, not averages or totals, relevant to our historical dataset It should not be a lagging metric such as return on investment
(ROI) or customer churn, both of which measure output after the fact. Lagging indicators become interesting later when we have achieved a product/market fit. By initially focusing on leading metrics, we can get an indication of what is likely to happen — and address a situation quicker to try and change the outcomes going forward.
The purpose of the OMTM is to gain objective evidence that the changes we are making to our product are having a measurable impact on the behavior of our customers. Ultimately we are seeking to understand:
- Are we making progress (the what)?
- What caused the change (the why)?
- How do we improve (the how)?
Use A3 Thinking as a Systematic Method for Realizing Improvement Opportunities
- A3 Thinking is composed of 7 elements embedding the Plan-Do-Check-Act cycle of experimentation:
- Background
- Current condition and problem statement
- Goal statement
- Root-cause analysis
- Countermeasures
- Check/confirmation effect
- Followup actions and report
Other examples include the Five Ws and One H (Who, What, Where, When, Why, How).

Figure 11. Example of A3 Thinking on a page
Remember, metrics are meant to hurt — not to make us feel like we are winning. They must be actionable and trigger a change in our behavior or understanding. We need to consider these two key questions when deciding on what our OMTM will be:
What is the problem we are trying to solve?
- Product development
- Tool selection
- Process improvement
What stage of the process are we at?
- Problem validation
- Solution validation
- MVP validation
Eric Ries introduced the term innovation accounting to refer to the rigorous process of defining, experimenting, measuring, and communicating the true progress of innovation for new products, business models, or initiatives.

Figure 12. Profitability to Sales ratio for early stage innovations
Measurement Fallacy
Unfortunately, often what we tend to see collected and socialized in organizations are vanity metrics designed to make us feel good but offering no clear guidance on what action to take. In Lean Analytics, Alistair Croll and Benjamin Yoskovitz note, “If you have a piece of data on which you cannot act, it’s a vanity metric…A good metric changes the way you behave. This is by far the most important criterion for a metric: what will you do differently based on changes in the metric?”
Examples of vanity versus actionable metrics

Figure 13. List of vanity metrics vs actionable metrics
Vanity vs. Actionable metrics
- Number of visits vs. Funnel metrics, cohort analysis
- Time on site, number of pages vs. Number of sessions per user
- Emails collected vs. Email action
- Number of downloads vs. User activations
- Tool usage vs. Tooling effect
- Number of trained people vs. Higher throughput
“If you can define the outcome you really want, give examples of it, and identify how those consequences are observable, then you can design measurements that will measure the outcomes that matter. The problem is that, if anything, managers were simply measuring what seemed simplest to measure (i.e., just what they currently knew how to measure), not what mattered most.”

Figure 14. Pirate AARRR metrics
Pirate metrics: AARRR!

Figure 15. Sample innovation scorecard
Example innovation scorecard
In terms of governance, the most important thing to do is have a regular weekly or fortnightly meeting which includes the product and engineering leads within the team, along with some key stakeholders from outside the team (such as a leader in charge of the Horizon 3 portfolio and its senior product and engineering representatives).
In the early stages, we must spend less time worrying about growth and focus on significant customer interaction. We may go so as far as to only acquire customers individually — too many customers too early can lead to a lack of focus and slow us down. We need to focus on finding passionate early adopters to continue to experiment and learn with. Then, we seek to engage similar customer segments to eventually “cross the chasm” to wider customer acquisition and adoption.
Our goal should to be to create a pull system for customers that want our product, service, or tools, not push a mandated, planned, and baked solution upon people that we must “sell” or require them to use.
Our runway should be a list of hypotheses to test, not a list of requirements to build. When we reward our teams for their ability to deliver requirements, it’s easy to rapidly bloat our products with unnecessary features — leading to increased complexity, higher maintenance costs, and limited ability to change. Features delivered are not a measure of success, business outcomes are.
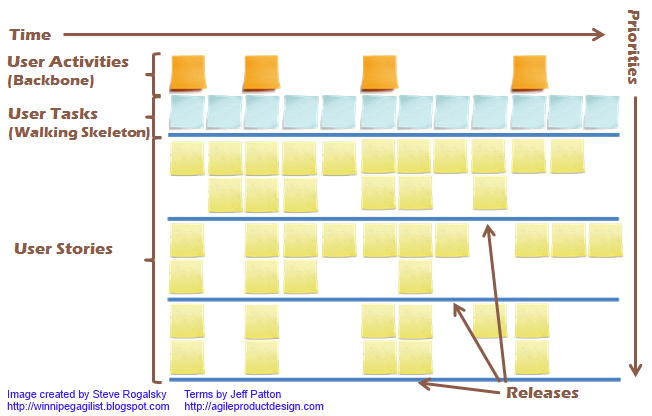
Figure 16. User Story Map sample
Create a Story Map to Tell the Narrative of the Runway of Our Vision Story maps are tool developed by Jeff Patton, explained in his book, User Story Mapping. As Patton states, “Your software has a backbone and a skeleton — and your map shows it.”
Our advice is this. There are two practices that should be adhered to from the beginning that will allow us to pay down technical debt later on: continuous integration and a small number of basic unit and user-journey tests.
Having forced ourselves to do something that should be unnatural to engineers — hack out embarrassingly crappy code and get out of the building to get validation from early on — we must then pull the lever hard in the other direction, kill the momentum, and transition our focus from building the right thing to building the thing right. Needless to say, this requires extreme discipline.
In The Lean Startup, Eric Ries argues that there are three key strategies for growth — choose one:
- Viral
- Includes any product that causes new customers to sign up as a necessary side effect of existing customers’ normal usage: Facebook, MySpace, AIM/ICQ, Hotmail, Paypal. Key metrics are acquisition and referral, combined into the now-famous viral coefficient.
- Pay
- Is when we use a fraction of the lifetime value of each customer and flow that back into paid acquisition through search engine marketing, banner ads, public relations, affiliates, etc. The spread between your customer lifetime value and blended customer acquisition cost determines either your profitability or your rate of growth, and a high valuation depends on balancing these two factors. Retention is the key goal in this model. Examples are Amazon and Netflix.
- Sticky
- Means something causes customers to become addicted to the product, and no matter how we acquire a new customer, we tend to keep them. The metric for sticky is the “churn rate” — the fraction of customers in any period who fail to remain engaged with our product or service. This can lead to exponential growth. For eBay, stickiness is the result of the incredible network effects of their business. For enterprises, however, there are further growth options to consider:
- Expand
- Is building an adaptive initial business model that we could simply evolve and expand further by opening up new geographies, categories, and adjacencies. Amazon has executed this strategy excellently, moving from selling books to an e-commerce store offering new retail categories. With this growth strategy, the initial targeted market should be large enough to support multiple phases of growth over time.
- Platform
- Once we have a successful core product, we transform it into a platform around which an “ecosystem” of complementary products and services is developed by both internal and external providers. Microsoft did this with Windows by creating MS Office, Money, and other support packages, including those developed by external vendors. Other platform examples include Apple’s AppStore, Salesforce’s Force.com, and Amazon’s Marketplace and Web Services offerings.
Part 111. Exploit

Figure 17. Water — Scrum — Fall
Figure 17. shows a typical “Water — Scrum — Fall method” project based paradigm established post WW2 to work on large military / aviation / space based projects. It represents a traditional phase-gate project paradigm, where no value is delivered until units were fully manufactured. Through detailed specifications very little change occurred in response to new information. None of these criteria apply to software based systems today.
We will present the following principles for lean-agile product development at scale:
- Implement an iterative continuous improvement process at the leadership level with concise, clearly specified outcomes to create alignment at scale, following the Principle of Mission.
- Work scientifically towards challenging goals, which will lead you to identifying and removing – or avoiding – no value-add activity.
- Use continuous delivery to reduce the risk of releases, decrease cycle time and make it economic to work in small batches.
- Evolve an architecture that supports loosely coupled customer facing teams which have autonomy in how they work to achieve the program-level outcomes
- Reduce batch sizes and take experimental approach to the product development process
- Increase and amplify feedback loops to make smaller, more frequent decisions based on the information we learn from performing our work to maximise customer value.
Achieving high performance in organisations that treat software as a strategic advantage relies on alignment between the IT function and the rest of the organisation, along with the ability of IT to execute.
The researchers concluded that to achieve high performance, companies that rely on software should focus first and foremost on their ability to execute, build reliable systems, and work to continually reduce complexity. Only then will pursuing alignment with business priorities pay off.
They approached this by using activity accounting — allocating costs to the activities the team is performing.
Money spent on support is generally serving failure demand, as distinct from value demand, which was only driving 5% of the team’s costs.
With Improvement Kata, everybody should be running experiments on a daily basis. Each day, people in the team go through answering the following five questions:
- What is the target condition?
- What is the actual condition now?
- What obstacles do you think are preventing you from reaching the target condition? Which one are you addressing now?
- What is your next step? (Start of PDCA cycle.) What do you expect?
- When can we go and see what we learned from taking that step?
As we continuously repeat the cycle, we reflect on the last step taken to introduce improvement. What did we expect? What actually happened? What did we learn? We might work on the same obstacle for several days.
Tom Gilb proposed in his 1988 work Principles of Software Engineering Management:
[perfectpullquote align=”full” bordertop=”false” cite=”” link=”” color=”” class=”” size=””]
We must set measurable objectives for each next small delivery step. Even these are subject to constant modification as we learn about reality. It is simply not possible to set an ambitious set of multiple quality, resource, and functional objectives, and be sure of meeting them all as planned. We must be prepared for compromise and trade-off. We must then design (engineer) the immediate technical solution, build it, test it, deliver it — and get feedback. This feedback must be used to modify the immediate design (if necessary), modify the major architectural ideas (if necessary), and modify both the short-term and the long-term objectives (if necessary).
[/perfectpullquote]
Even today, many people think that Lean is a management-led activity and that it’s about simply cutting costs. In reality, it requires investing to remove waste and reduce failure demand — it is a worker-led activity that, ultimately, can continuously drive down costs and improve quality and productivity.
It’s often hard to make the outcome of improvement work tangible — which is why it’s important to make it visible by activity accounting, including measuring the cycle time and the time spent serving failure demand such as rework.
Identifying Value and Increase Flow
The actual number used to prioritise features is known as cost of delay divided by duration (or “CD3”). It is calculated as cost of delay for a feature divided by the amount of time we estimate it will take to develop and deliver that feature. This takes into account the fact that we have limited people and resources available to complete work, and that if a particular feature takes a long time to develop it will “push out” other features.
The best way to understand where problems start is by performing an activity called value stream mapping.

Figure 18. Sample Value Stream Map
We can visualise the dynamics of the value stream by creating a cumulative flow diagram that shows the amount of work in each queue and process block over time. A cumulative flow diagram showing delivery progress over time, the different phases/queues work flows from (from Backlog to Validated Learning), identifies work in progress (WIP) and average lead time as shown in Figure 19.

Figure 19. Cumulative Flow Diagram
The Kanban Method offers a comprehensive way to manage the flow of work through the product development value stream by using the following practices:
- Visualise workflow by creating a board showing the current work in process within the value stream in real time.
- Limit work in process by setting WIP limits for each process block and queue within a value stream, and updating them in order to trade off lead time against utilisation (how busy people are).
- Define classes of service for different types of work and the processes through which they will be managed, to ensure that urgent or time-sensitive work is prioritised appropriately.
- Create a pull system by agreeing on how work will be accepted into each process block when capacity becomes available — perhaps by setting up a regular meeting where stakeholders decide what work should be prioritised based on available capacity.
- Hold regular “operational reviews” for the stakeholders within each process block to analyse their performance and update WIP limits, classes of service, and the method through which work is accepted.

Figure 20. Sample Kanban board
Reducing lead times in this way requires that there be sufficient slack in the system to manage the WIP effectively.
The Fundamentals of Continuous Delivery
There are two golden rules of continuous delivery that must be followed by everybody:
- The team is not allowed to say they are “done” with any piece of work until their code is in trunk on version control and releasable (for hosted services the bar is even higher — “done” means deployed to production). In The Lean Startup, Eric Ries argues that for new features that aren’t simple user requests, the team must also have run experiments on real users to determine if the feature achieves the desired outcome.
- The team must prioritise keeping the system in a deployable state over doing new work. This means that if at any point we are not confident we can take whatever is on trunk in version control and deliver it to users through an automated, push-button process, we need to stop working and fix that problem.
To find out if you’re really doing CI, ask your team the following questions:
- Are all the developers on the team checking into trunk (not just merging from trunk into their branches or working copies) at least once a day? In other words, are they doing trunk-based development and working in small batches?
- Does every change to trunk kick off a build process, including running a set of automated tests to detect regressions?
- When the build and test process fails, does the team fix the build within a few minutes, either by fixing the breakage or by reverting the change that caused the build to break?
If the answer to any of these questions is “no,” you aren’t practicing continuous integration.
The most important principle for doing low-risk releases is this: decouple deployment and release. To understand this principle, we must first define these terms. Deployment is the installation of a given version of a piece of software to a given environment. The decision to perform a deployment — including to production — should be a purely technical one. Release is the process of making a feature, or a set of features, available to customers. Release should be a purely business decision.

Figure 21. As organizations work to implement continuous delivery, they will have to change the way they approach version control, software development, architecture, testing, and infrastructure and database management
However, we do not propose solutions to achieve these goals or write stories or features (especially not “epics”) at the program level. Rather, it is up to the teams within the program to decide how they will achieve these goals. This is critical to achieving high performance at scale, for two reasons:
- The initial solutions we come up with are unlikely to be the best. Better solutions are discovered by creating, testing, and refining multiple options to discover what best solves the problem at hand.
- Organisations can only move fast at scale when the people building the solutions have a deep understanding of both user needs and business strategy and come up with their own ideas.
A program-level backlog is not an effective way to drive these behaviours — it just reflects the almost irresistible human tendency to specify “the means of doing something, rather than the result we want.”
Getting to Target Conditions
Gojko Adzic presents a technique called impact mapping to break down high-level business goals at the program level into testable hypotheses. Adzic describes an impact map as “a visualisation of scope and underlying assumptions, created collaboratively by a cross-functional group of stakeholders. It is a mind-map grown during a discussion facilitated by answering the following questions:
- Why?
- Who?
- How?
- What?”

Figure 22. Impact Mapping
Once we have a prioritised list of target conditions and impact maps created collaboratively by technical and business people, it is up to the teams to determine the shortest possible path to the target condition. This tool differs in important ways from many standard approaches to thinking about requirements. Here are some of the important differences and the motivations behind them:
- There are no lists of features at the program level
- Features are simply a mechanism for achieving the goal. To paraphrase Adzic, if achieving the target condition with a completely different set of features than we envisaged won’t count as success, we have chosen the wrong target condition. Specifying target conditions rather than features allows us to rapidly respond to changes in our environment and to the information we gather from stakeholders as we work towards the target condition. It prevents “feature churn” during the iteration. Most importantly, it is the most effective way to make use of the talents of those who work for us; this motivates them by giving them an opportunity to pursue mastery, autonomy, and purpose.
- There is no detailed estimation
- We aim for a list of target conditions that is a stretch goal — in other words, if all our assumptions are good and all our bets pay off, we think it would be possible to achieve them. However, this rarely happens, which means we may not achieve some of the lower-priority target conditions. If we are regularly achieving much less, we need to rebalance our target conditions in favour of process improvement goals. Keeping the iterations short — 2–4 weeks initially — enables us to adjust the target conditions in response to what we discover during the iteration. This allows us to quickly detect if we are on a wrong path and try a different approach before we overinvest in the wrong things.
- There are no “architectural epics”
- The people doing the work should have complete freedom to do whatever improvement work they like (including architectural changes, automation, and refactoring) to best achieve the target conditions. If we want to drive out particular goals which will require architectural work, such as compliance or improved performance, we specify these in our target conditions.
First, we create a hypothesis based on our assumption. In Lean UX, Josh Seiden and Jeff Gothelf suggest the template shown below to use as a starting point for capturing hypotheses.
[perfectpullquote align=”full” bordertop=”false” cite=”” link=”” color=”” class=”” size=””]
We believe that
[building this feature]
[for these people]
will achieve [this outcome].
We will know where we are successful when we see [this signal from the market].
[/perfectpullquote]
There are many different ways to conduct research, generate results and assess against your hypothesis. See figure 22. below which shows some different methods of user research, across four quadrants of generative, evaluative, quantitative and qualitative. For more on different types of user research, read UX for Lean Startups (O’Reilly) by Laura Klein.

Figure 23. Types of User Research across four quadrants of generative, evaluative, quantitative and qualitative
The key outcome of an experiment is information: we aim to reduce the uncertainty as to whether the proposed work will achieve the target condition.
Ronny Kohavi, who directed Amazon’s Data Mining and Personalisation group before joining Microsoft as General Manager of its Experimentation Platform, reveal that 60%–90% of ideas do not improve the metric they were intended to improve. Thus if we’re not running experiments to test the value of new ideas before completely developing them, the chances are that about 2/3 of the work we are doing is of either zero or negative value to our customers — and certainly of negative value to our organisation, since this work costs us in three ways.
They were able to calculate a dollar amount for the revenue impact of performance improvements, discovering that “an engineer that improves server performance by 10 msec more than pays for his fully-loaded annual costs.”
One of the most common challenges encountered in software development is the focus of teams, product managers, and organisations on managing cost rather than value. This typically manifests itself in undue effort spent on zero-value-add activities such as detailed upfront analysis, estimation, scope management, and backlog grooming. These symptoms are the result of focusing on maximising utilisation (keeping our expensive people busy) and output (measuring their work product) — instead of focusing on outcomes, minimising the output required to achieve them, and reducing lead times to get fast feedback on our decisions.
Implement Mission Command
CEO Jeff Bezos turned this problem into an opportunity. He wanted Amazon to become a platform that other businesses could leverage, with the ultimate goal of better meeting customer needs. With this in mind, he sent a memo to technical staff directing them to create a service-oriented architecture, which Steve Yegge summarizes thus:
- All teams will henceforth expose their data and functionality through service interfaces.
- Teams must communicate with each other through these interfaces.
- There will be no other form of interprocess communication allowed: no direct linking, no direct reads of another team’s data store, no shared-memory model, no back-doors whatsoever. The only communication allowed is via service interface calls over the network.
- It doesn’t matter what technology they use. HTTP, Corba, Pubsub, custom protocols — doesn’t matter. Bezos doesn’t care.
- All service interfaces, without exception, must be designed from the ground up to be externalisable. That is to say, the team must plan and design to be able to expose the interface to developers in the outside world. No exceptions.
- Anyone who doesn’t do this will be fired.
Bezos hired West Point Academy graduate and ex-Army Ranger Rick Dalzell to enforce these rules. Bezos mandated another important change along with these rules: each service would be owned by a cross-functional team that would build and run the service throughout its lifecycle. As Werner Vogels, CTO of Amazon, says, “You build it, you run it.”
Amazon stipulated that all teams must conform to the “two pizza” rule: they should be small enough that two pizzas can feed the whole team — usually about 5 to 10 people. This limit on size has four important effects:
- It ensures the team has a clear, shared understanding of the system they are working on. As teams get larger, the amount of communication required for everybody to know what’s going on scales in a combinatorial fashion.
- It limits the growth rate of the product or service being worked on. By limiting the size of the team, we limit the rate at which their system can evolve. This also helps to ensure the team maintains a shared understanding of the system.
- Perhaps most importantly, it decentralises power and creates autonomy, following the Principle of Mission. Each two-pizza team (2PT) is as autonomous as possible. The team’s lead, working with the executive team, would decide upon the key business metric that the team is responsible for, known as the fitness function, that becomes the overall evaluation criteria for the team’s experiments. The team is then able to act autonomously to maximise that metric
- Leading a 2PT is a way for employees to gain some leadership experience in an environment where failure does not have catastrophic consequences — which “helped the company attract and retain entrepreneurial talent.”
To avoid the communication overhead that can kill productivity as we scale software development, Amazon leveraged one of the most important laws of software development — Conway’s Law: “Organisations which design systems…are constrained to produce designs which are copies of the communication structures of these organisations.” One way to apply Conway’s Law is to align API boundaries with team boundaries. In this way we can distribute teams all across the world. Organisations often try to fight Conway’s Law. A common example is splitting teams by function, e.g., by putting engineers and testers in different locations (or, even worse, by outsourcing testers). Another example is when the front end for a product is developed by one team, the business logic by a second, and the database by a third. Since any new feature requires changes to all three, we require a great deal of communication between these teams, which is severely impacted if they are in separate locations. Splitting teams by function or architectural layer typically leads to a great deal of rework, disagreements over specifications, poor handoffs, and people sitting idle waiting for somebody else.
In truly decentralised organisations, we follow the principle of subsidiarity: by default, decisions should be made by the people who are directly affected by those decisions. Higher levels of bureaucracy should only perform tasks that cannot be performed effectively at the local level — that is, the authority of higher levels of bureaucracy should be subsidiary to that of the local levels.
We ensure teams are aligned by using the Improvement Kata that is, by having iterations at the program level with defined target conditions and having teams collaborate to work out how to achieve them. Here are some strategies enterprises have successfully applied to create autonomy for individual teams:
- Give teams the tools and authority to push changes to production
- In companies such as Amazon, Netflix, and Etsy, teams, in many cases, do not need to raise tickets and have changes reviewed by an advisory board to get them deployed to production. In fact, in Etsy this authority is devolved not just to teams but to individual engineers. Engineers are expected to consult with each other before pushing changes, and certain types of high-risk changes (such as database changes or changes to a PCI-DSS cardholder data environment) are managed out of band. But in general, engineers are expected to run automated tests and consult with other people on their team to determine the risk of each change — and are trusted to act appropriately based on this information. ITIL supports this concept in the form of standard changes. All changes that launch dark (and which thus form the basis of A/B tests) should be considered standard changes. In return, it’s essential that teams are responsible for supporting their changes.
- Ensure that teams have the people they need to design, run, and evolve experiments
- Each team should have the authority and necessary skills to come up with a hypothesis, design an experiment, put an A/B test into production, and gather the resulting data. Since the teams are small, this usually means they are cross-functional with a mix of people: some generalists with one or two deep specialisms (sometimes known as “T-shaped” people8), along with specialist staff such as a database administrator, a UX expert, and a domain expert. This does not preclude having centralised teams of specialists who can provide support to product teams on demand.
- Ensure that teams have the authority to choose the their own toolchain
- Mandating a toolchain for a team to use is an example of optimising for the needs of procurement and finance rather than for the people doing the work. Teams must be free to choose their own tools. One exception to this is the technology stack used to run services in production. Ideally, the team will use a platform or infrastructure service (PaaS or IaaS) provided by internal IT or an external provider, enabling teams to self-service deployments to testing and (where applicable) production environments on demand through an API (not through a ticketing system or email). If no such system exists, or it is unsuitable, the team should be allowed to choose their own stack — but must be prepared to meet any applicable regulatory constraints and bear the costs of supporting the system in production.
- Ensure teams do not require funding approval to run experiments
- The techniques described in this book make it cheap to run experiments, so funding should not be a barrier to test out new ideas. Teams should not require approval to spend money up to a a certain limit
- Ensure leaders focus on implementing Mission Command
- In a growing organisation, leaders must continuously work to simplify processes and business complexity, to increase effectiveness, autonomy, and capabilities of the smallest organisational units, and to grow new leaders within these units.
Creating small, autonomous teams makes it economic for them to work in small batches. When done correctly, this combination has several important benefits:
- Faster learning, improved customer service, less time spent on work that does not add value
- Better understanding of user needs
- Highly motivated people
- Easier to calculate profit and loss
Architecting for continuous delivery and service orientation means evolving systems that are testable and deployable. Testable systems are those for which we can quickly gain a high level of confidence in the correctness of the system without relying on extensive manual testing in expensive integrated environments. Deployable systems are those that are designed to be quickly, safely, and independently deployed to testing and (in the case of web-based systems) production environments. These “cross-functional” requirements are just as important as performance, security, scalability, and reliability, but they are often ignored or given second-class status.
Amazon did not replace their monolithic Obidos architecture in a “big bang” replacement program. Instead, they moved to a service-oriented architecture incrementally, while continuing to deliver new functionality, using a pattern known as the “strangler application.” As described by Martin Fowler, the pattern involves gradual replacement of a system by implementing new features in a new application that is loosely coupled to the existing system, porting existing functionality from the original application only where necessary. Over time, the old application is “strangled” — just like a tree enveloped by a tropical strangler fig.
Part IV. Transform
To add further complexity to this problem, many of our traditional approaches to governance, risk, and compliance (GRC), financial management, procurement, vendor/supplier management, and human resources (recruiting, promotion, compensation) create additional waste and bottlenecks. These can only be eliminated when the entire organisation embraces lean concepts and everyone works together in the same direction.
In The Corporate Culture Survival Guide, Schein defines culture as “a pattern of shared tacit assumptions that was learned by a group as it solved its problems of external adaptation and internal integration, that has worked well enough to be considered valid and, therefore, to be taught to new members as the correct way to perceive, think, and feel in relation to those problems.”
Your Startup Is Broken: Inside the Toxic Heart of Tech Culture, provides another perspective, commenting that “our true culture is made primarily of the things no one will say…Culture is about power dynamics, unspoken priorities and beliefs, mythologies, conflicts, enforcement of social norms, creation of in/out groups and distribution of wealth and control inside companies.”
In his management classic The Human Side of Enterprise, Douglas McGregor describes two contrasting sets of beliefs held by managers he observed, which he calls Theory X and Theory Y. Managers who hold Theory X assumptions believe that people are inherently lazy and unambitious and value job security more than responsibility; extrinsic (carrot-and-stick) motivation techniques are the most effective to deal with workers. In contrast, Theory Y managers believe “that employees could and would link their own goals to those of the organisation, would delegate more, function more as teachers and coaches, and help employees develop incentives and controls that they themselves would monitor.”
People involved in non routine work are motivated by intrinsic factors summarised by Dan Pink as:
- Autonomy — the desire to direct our own lives.
- Mastery — the urge to get better and better at something that matters.
- Purpose — the yearning to do what we do in the service of something larger than ourselves.
Culture is hard to change by design. As Schein says, “Culture is so stable and difficult to change because it represents the accumulated learning of a group — the ways of thinking, feeling, and perceiving the world that have made the group successful.”
MIT Sloan Management Review, John Shook, Toyota City’s first US employee, reflected on how that cultural change was achieved:
- What my NUMMI experience taught me that was so powerful was that the way to change culture is not to first change how people think, but instead to start by changing how people behave — what they do. Those of us trying to change our organisations’ culture need to define the things we want to do, the ways we want to behave and want each other to behave, to provide training and then to do what is necessary to reinforce those behaviours. The culture will change as a result…What changed the culture at NUMMI wasn’t an abstract notion of “employee involvement” or “a learning organisation” or even “culture” at all. What changed the culture was giving employees the means by which they could successfully do their jobs. It was communicating clearly to employees what their jobs were and providing the training and tools to enable them to perform those jobs successfully.
It’s hard to achieve sustained, systemic change without any crisis. In The Corporate Culture Survival Guide, Schein asks if crisis is a necessary condition of successful transformations; his answer is, “Because humans avoid unpredictability and uncertainty, hence create cultures, the basic argument for adult learning is that indeed we do need some new stimulus to upset the equilibrium. The best way to think about such a stimulus is as disconfirmation: something is perceived or felt that is not expected and that upsets some of our beliefs or assumptions…disconfirmation creates survival anxiety — that something bad will happen if we don’t change — or guilt — we realize that we are not achieving our own ideals or goals.”

Figure 24. Old and new approaches to cultural change
Once people accept the need for change, they are confronted with the fear that they may fail at learning the new skills and behaviour required of them, or that they may lose status or some significant part of their identity — a phenomenon Schein calls learning anxiety. Schein postulates that for change to succeed, survival anxiety must be greater than learning anxiety, and to achieve this, “learning anxiety must be reduced rather than increasing survival anxiety.”
At the beginning of every postmortem, every participant should read aloud the following words, known as the Retrospective Prime Directive: “Regardless of what we discover, we understand and truly believe that everyone did the best job they could, given what they knew at the time, their skills and abilities, the resources available, and the situation at hand.”
Given that the culture of an organisation has such a dominant effect on the performance of individuals, should we care at all about the particular skills and attitudes of individuals? Instead of taking a “bank account” view that focuses on people’s existing capabilities, it’s more important to consider their ability to acquire new skills — particularly in the field of technology where useful knowledge and skills change rapidly.

Figure 25. Dwecks two mindsets – Fixed & Growth Mindset
Google has done a great deal of research into what makes for an effective recruiting process in the context of technology. The top three criteria are:
- Learning ability, including the ability to “process on the fly” and “pull together disparate bits of information.”
- Leadership, “in particular emergent leadership as opposed to traditional leadership. Traditional leadership is, were you president of the chess club? Were you vice president of sales? How quickly did you get there? We don’t care. What we care about is, when faced with a problem and you’re a member of a team, do you, at the appropriate time, step in and lead. And just as critically, do you step back and stop leading, do you let someone else? Because what’s critical to be an effective leader in this environment is you have to be willing to relinquish power.”
- Mindset. “Successful bright people rarely experience failure, and so they don’t learn how to learn from that failure…They, instead, commit the fundamental attribution error, which is if something good happens, it’s because I’m a genius. If something bad happens, it’s because someone’s an idiot or I didn’t get the resources or the market moved.”
Bock goes on to observe that the most successful people at Google “will have a fierce position. They’ll argue like hell. They’ll be zealots about their point of view. But then you say, here’s a new fact, and they’ll go, Oh, well, that changes things; you’re right”. To deal with an uncertain future and still move forward, people should have “strong opinions, which are weakly held.”
Embrace Lean Thinking for Governance, Risk and Compliance
We often hear that Lean Startup principles and the techniques and practices we suggest in this book would never work in large enterprises because of governance. “This won’t meet regulatory requirements.” “That doesn’t fit in our change management process.” “Our team can’t have access to servers or production.” These are just a few examples of the many reasons people have given for dismissing the possibility of changing the way they work. When we hear these objections, we recognise that people aren’t really talking about governance; they are referring to processes that have been put in place to manage risk and compliance and conflating them with governance. Like any other processes within an organisation, those established for managing governance, risk, and compliance (GRC) must be targets for continuous improvement to ensure they contribute to overall value. We refer to “GRC teams.” For clarity, our discussion and examples focus on teams that strongly influence how technology can be used within organisations; the more common ones are the PMO, technical architecture, information security, risk and compliance, and internal audit teams.
Governance is about keeping our organisation on course. It is the primary responsibility of the board of directors, but it applies to all people and other entities working for the organisation. It requires the following concepts and principles to be applied at all levels:
- Responsibility
- Each individual is responsible for the activities, tasks, and decisions they make in their day-to-day work and for how those decisions affect the overall ability to deliver value to stakeholders.
- Authority or accountability
- There is an understanding of who has the power and responsibility to influence behaviours within the organisation and of how it works.
- Visibility
- Everyone at all times can view the outcomes achieved by the organisation and its components, based on current and real data. This, in turn, can be mapped to the organisation’s strategic goals and objectives.
- Empowerment
- The authority to act to improve the delivery of value to stakeholders is granted at the right level — to the people who will deal with the results of the decision.
Risk is the exposure we run for the possibility of something unpleasant occurring. We all manage risks daily, at work, home, and play. As it is impossible to eliminate every risk, the question to be answered in managing risk is, “Which risks are you willing to live with?”
Compliance is obedience to laws, industry regulations, legally binding contracts, and even cultural norms. The intention of mandated compliance is usually to protect the interest of stakeholders with regard to privacy of information, physical safety, and financial investments.
Management Is Not Governance COBIT clearly explains the difference between governance and management.
- Governance ensures that stakeholder needs, conditions, and options are evaluated to determine balanced agreed-on enterprise objectives to be achieved; sets direction through prioritisation and decision making; and monitors performance and compliance against agreed-on direction and objectives.
- Management plans, builds, runs, and monitors activities in alignment with the direction set by the governance body to achieve the enterprise objectives.
Good GRC management maintains a balance between implementing enough control to prevent bad things from happening and allowing creativity and experimentation to continuously improve the value delivered to stakeholders.
Unfortunately, many GRC management processes within enterprises are designed and implemented within a command-and-control paradigm. They are highly centralised and are viewed as the purview of specialised GRC teams, who are not held accountable for the outcomes of the processes they mandate. The processes and controls these teams decree are often derived from popular frameworks without regard to the context in which they will be applied and without considering their impact on the entire value stream of the work they affect. They often fail to keep pace with technology changes and capabilities that would allow the desired outcomes to be achieved by more lightweight and responsive means. This forces delivery teams to complete activities adding no overall value, create bottlenecks, and increase the overall risk of failure to deliver in a timely manner.
In How to Measure Anything, Douglas Hubbard reports Peter Tippet of Cybertrust discussing “what he finds to be a predominant mode of thinking about [IT security]. He calls it the ‘wouldn’t it be horrible if…’ approach. In this framework, IT security specialists imagine a particularly catastrophic event occurring. Regardless of its likelihood, it must be avoided at all costs. Tippet observes: ‘since every area has a “wouldn’t it be horrible if…” all things need to be done. There is no sense of prioritisation.’” When prioritising work across our portfolio, there must be no free pass for work mitigating “bad things” to jump to the front of the line. Instead, quantify risks by considering their impacts and probabilities using impact mapping and then use Cost of Delay to balance the mitigation work against other priorities. In this way we can manage security and compliance risks using an economic framework instead of fear, uncertainty, and doubt.
When GRC teams do not take a principles-based approach and instead prescribe the rules that teams must blindly follow, the familiar result is risk management theater: an expensive performance that is designed to give the appearance of managing risk but actually increases the chances of unintended negative consequences.
Preventive controls, when executed on the wrong level, often lead to unnecessarily high costs, forcing teams to:
- Wait for another team to complete menial tasks that can be easily automated and run when needed
- Obtain approvals from busy people who do not have a good understanding of the risks involved in the decision and thus become bottlenecks
- Create large volumes of documentation of questionable accuracy which becomes obsolete shortly after it is finished
- Push large batches of work to teams and special committees for approval and processing and then wait for responses
To meet compliance and reduce security risks, many organisations now include information security specialists as members of cross-functional product teams. Their role is to help the team identify what are the possible security threats and what level of controls will be required to reduce them to an acceptable level. They are consulted from the beginning and are engaged in all aspects of product delivery: Contributing to design for privacy and security Developing automated security tests that can be included in the deployment pipeline Pairing with developers and testers to help them understand how to prevent adding common vulnerabilities to the code base Automating the process of testing security patches to systems. As working members of the team, information security specialists help shorten feedback loops related to security, reduce overall security risks in the solution, improve collaboration and the knowledge of information security issues in other team members, and themselves learn more about the context of the code and the delivery practices.
Evolve Financial Management to Drive Product Innovation
In many large enterprises, financial management processes (FMPs) are designed around the project paradigm. This presents an obstacle to taking a product-based approach to innovation. It is relatively easy for small teams to work and collaborate amongst themselves. However, on an enterprise scale, we eventually reach a point where evolution is blocked by rigid, centralised FMPs that drive the delivery and procurement processes that limit the options for innovating at scale.
We consider the organisational financial management practices within enterprises that are typically identified as deterrents to innovation:
- Basing business decisions on a centralised annual budget cycle, with exceptions considered only under extreme circumstances. This combines forecasting, planning, and monitoring into a single centralised process, performed once a year, which results in suboptimal output from each of these important activities.
- Using the capability to hit budget targets as a key indicators of performance for individuals, teams, and the organisation as a whole, which merely tells you how well people play the process but not the outcomes they have achieved over the past year.
- Basing business decisions on the financial reporting structure of capital versus operating expense. This limits the ability to innovate by starting with a minimal viable product that grows gradually or can be discarded at any time. The CapEx/OpEx model of reporting costs is largely based on physical assets and is project based; it does not translate well to the use of information to experiment, learn, and continually improve products over time.
However, in the context of product development, the traditional annual budget cycle can easily:
- Reduce transparency into the actual costs of delivering value — costs are allocated by functional cost centers or by which bucket the money comes from, without an end-to-end product view.
- Remove decisions from the people doing the work — the upper management establishes and mandates detailed targets.
- Direct costs away from value creation by enforcing exhaustive processes for approving, tracking, and justifying costs.
- Measure performance by the ability to please the boss or produce output — not by actual customer outcomes — by rewarding those who meet budget targets, no matter what the overall and long-range cost may be.
The great planning fallacy, evident in the centralised budget process, is that if we develop a detailed upfront financial plan for the upcoming year, it will simply happen — if we stick to the plan. The effort to develop these kinds of plans is a waste of time and resources, because product development is as much about discovery as it is about execution. Costs will change, new opportunities will arise, and some planned work will turn out not to generate the desired outcomes. In today’s world of globalisation, rapid technology growth, and increasing unpredictability it is foolish to think that accurate, precise plans are achievable or even desirable.
Activity-based accounting (or costing) allows us to allocate the total costs of services and activities to the business activity or product that drives those costs. It provides us with a better picture of the true financial value being delivered by the product.
However, this prevents us from paying attention to the most important questions: did we plan at the right level, set good targets, get more efficient, or improve customer satisfaction? Are our products improving or dying? Are we in a better financial position than we were before?
The traditional process also serves to obscure the true cost of ownership and escalates operating costs. A project will be fully capitalised, allowing us to spread out the reporting of that cost over an extended period, so it has less short-term impact on our profit. However, many of the items that are being capitalised during the initial project have an immediate negative impact on our OpEx, starting before or immediately after the project dissipates. The long-term operating costs required to support the increasing complexity of systems created by projects are not calculated when capitalised projects are approved (because they don’t come out of the same bucket). Ongoing support and retirement of products and services is an OpEx problem. In the end, OpEx teams are stuck with justifying their ever growing costs caused by the bloat and complexity created by CapEx decisions. If we are serious about innovation, it shouldn’t really matter which bucket funding comes from. Open, frank discussion, based on real evidence of the total end-to-end cost of the product, is what we should use as the basis of business decisions. Funding allocation of a product’s development into CapEx or OpEx should be performed by accountants after the business decisions are made.
The first mistake in the typical procurement process is thinking with large amounts of upfront planning, we can manage thge risk of getting something that doesnt delivery the expected value, normally completed using a request for proposal (RFP) which has several negative side effects:
- Its a poor way to manage the risks of product development
- It favours incumbents
- It favours large service providers
- It inhibits transparency
- It is inaccurate
- It ignores outcomes
The second mistake in the typical procurement process is that is assumes all services are equal in both the quality of the people working on the delivery and the quality of the software delivered.
Turn IT into a Competitive Advantage
High-performing IT organisations are able to achieve both high throughput, measured in terms of change lead time and deployment frequency, and high stability, measured as the time to restore service after an outage or an event that caused degraded quality of service. High-performing IT organisations also have 50% lower change fail rates than medium- and low-performing IT organisations.
The practices most highly correlated with high IT performance (increasing both throughput and stability) are:
- Keeping systems configuration, application configuration, and application code in version control
- Logging and monitoring systems that produce failure alerts
- Developers breaking up large features into small, incremental changes that are merged into trunk daily
- Developers and operations regularly achieving win/win outcomes when they interact
There are two other factors that strongly predict high performance in IT. The first is a high-trust organisational culture. The second is a lightweight peer-reviewed change approval process.
Instead of creating controls to compensate for pathological cultures, the solution is to create a culture in which people take responsibility for the consequences of their actions — in particular, customer outcomes. There is a simple but far-reaching prescription to enable this behaviour:
- You build it, you run it.
- Turn central IT into a product development organisation.
- Invest in reducing the complexity of existing systems.
While moving to external cloud suppliers carries different risks compared to managing infrastructure in-house, many of the reasons commonly provided for creating a “private cloud” do not stand up to scrutiny. Leaders should treat objections citing cost and data security with skepticism: is it reasonable to suppose your company’s information security team will do a better job than Amazon, Microsoft, or Google, or that your organisation will be able to procure cheaper hardware?
When using COTS, it is crucial not to customise the packages. We can’t emphasise strongly enough the problems and risks associated with customising COTS. When organisations begin customising, it’s hard to stop — but customisations of COTS packages are extremely expensive to build and maintain over time. Once you get beyond a certain amount of customisation, the original vendor will often no longer support the package. Upgrading customised packages is incredibly painful, and it’s hard to make changes quickly and safely to a customised COTS system.
Start Where You Are
First, starting small with a cross-functional team and gradually growing the capability of the product, while delivering value iteratively and incrementally, is an extremely effective way to mitigate the risks of replacing high-visibility systems, while simultaneously growing a high-performance culture. It provides a faster return on investment, substantial cost savings, and happier employees and users. This is possible even in a complex, highly regulated environment such as the government. Second, instead of trying to replace existing systems and processes in a “big bang,” the GDS replaced them incrementally, choosing to start where they could most quickly deliver value. They took the “strangler application” pattern and used it to effect both architectural and organisational change. Third, the GDS pursued principle-based governance. The leadership team at GDS does not tell every person what to do but provides a set of guiding principles for people to make decisions aligned to the objectives of the organisation. The GDS governance principles state:
- Don’t slow down delivery.
- Decide, when needed, at the right level.
- Do it with the right people.
- Go see for yourself.
- Only do it if it adds value.
- Trust and verify.
People are trusted to make the best decisions in their context, but are accountable for those decisions — in terms of both the achieved outcomes and knowing when it is appropriate to involve others.


